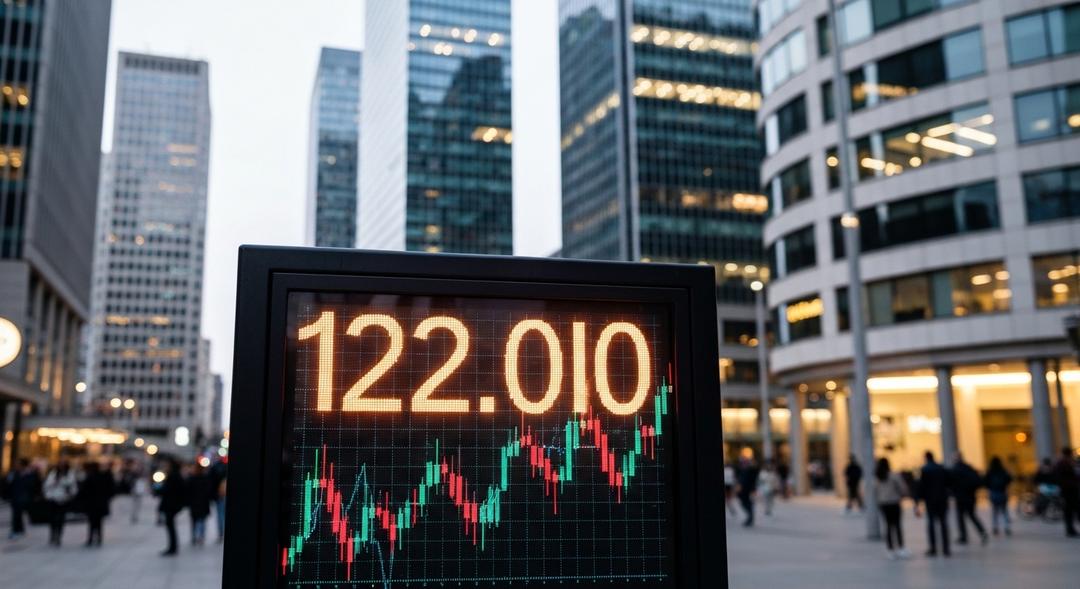
Bitcoin’s recent rally has met resistance just above the $122000 level. Traders are observing chart patterns for clues about where prices could head next.
Despite strong momentum earlier in the month, Bitcoin failed twice to break above technical resistance at $122056. These twin rejections happened within a similar price zone, suggesting a possible double top has formed. This pattern typically signals a loss of bullish strength and raises concerns among market participants.
A double top appears when an asset forms two consecutive peaks, separated by a pullback, at roughly the same level. For Bitcoin, that pullback saw prices drop as low as $111982. Analysts focus on this trough as a critical line of support. Should the price fall below it, there could be increased selling pressure as traders look to exit before greater declines.
The measurement of a double top’s downside target involves subtracting the distance between the resistance peaks and the neckline, then projecting that same drop downward. Applying this to Bitcoin, a confirmed breakdown could see the market aiming for the $100000 zone. This method of projecting price targets is well established in technical analysis circles and has historically provided useful guidelines for identifying risk levels.
The context for this pattern makes it particularly notable. Double tops are most valid after a significant upward trend, which Bitcoin has undoubtedly experienced over the past several months. A prolonged period of healthy price appreciation often creates ideal conditions for such reversal setups to emerge.
Supporting and resistance levels remain firmly in focus. The crucial support now stands at $111982, with additional buying interest likely at $100000, which also carries psychological significance. Resistance is clustered at $120000, $122056, and $123181, marking clear hurdles that bulls must overcome to regain control. These levels help traders plan entries, exits and safeguard strategies against the backdrop of heightened market uncertainty.
The broader economic environment adds another layer of complexity. Traders are keenly watching for the outcome of the latest US Consumer Price Index data, which is expected to influence sentiment and direction. A stronger than expected inflation report could dampen speculation about rate cuts from the Federal Reserve, hitting risk assets and adding to the potential downside for Bitcoin.
Buyer fatigue appears to be creeping in as recent attempts to lift prices consistently above key resistance have faltered. This waning enthusiasm among bulls suggests that bears are regaining influence right when the market is bracing for new economic data. The balance of power seems to be shifting as anticipation builds for the next round of macroeconomic results.
Earlier this year, a similar double top pattern near $100000 led to a notable correction, with prices dipping below $75000 in April. Technical patterns do not offer guarantees, but many in the market weigh them heavily alongside other indicators. Retracements after extended rallies often shake out weaker hands and establish new support bases for the next upward phase.
For anyone new to digital asset markets, understanding these common chart formations is crucial. When reversals appear after lengthy rallies, risk management strategies become even more vital. The rapid swings often seen in Bitcoin put a premium on careful planning and disciplined decision making.
Another avenue traders are exploring involves the cloud mining sector, which has grown in appeal as volatility increases. Those wishing to participate in mining without owning hardware may choose to Start Cloud Mining as a way to diversify exposure and benefit from market shifts without direct trading. This strategy allows for an alternative approach to earning Bitcoin during uncertain times.
Technical guidelines for double tops are not hard rules but serve as a framework to interpret price behavior within broader trends. The formation’s timing, magnitude and market context all affect its reliability. Candlestick patterns, support breaks and momentum changes are all watched closely by seasoned analysts to confirm or challenge an emerging trend.
While speculation and debate about the next directional move continue, many investors are content to wait for a decisive break of either resistance or support. The coming days are likely to provide pivotal data points that clarify whether Bitcoin can mount another assault on the all time high or will retrace to build a new foundation.
Conclusion
As momentum stalls near major price ceilings, Bitcoin’s immediate path looks increasingly tied to external forces such as inflation reports and expectations for central bank moves. The struggle to push above $122000 reflects a market caught between lingering optimism and rising caution. Chart watchers and seasoned traders alike continue to monitor key levels for clues that could resolve the standstill and set the tone for the remainder of the year.
In the meantime, those involved in Bitcoin can use volatility as a prompt to reevaluate strategies and stay prepared for abrupt changes. Whether through active trading, longer term positioning, or seeking alternative methods like cloud mining, resilience and flexibility remain essential for navigating turbulent periods in the cryptocurrency market.

Ewan’s fascination with cryptocurrency started through his curiosity about innovative technologies reshaping the financial world. Over the past four years, he has specialized in cloud mining and crypto asset management, diving deep into mining contracts, profitability analysis, and emerging trends. Ewan is dedicated to helping readers understand the technical and economic aspects of crypto mining, making complex information accessible and actionable.